Finding Optimal Solution on Graphing Calculator
Optimization with Desmos Graphing Calculator (spreadsheets optional)
![]()
In my previous post, I showed you how my class used spreadsheets create a matrix calculator that als o solves systems of linear equations. In this post, we, we take it one step further to address systems of inequalities as well. Solving systems algebraically is great for finding intersection points (solutions to the system), but there are other methods as well. Graphing for example, will also provide us with a solution to a system. The advantage we gain from graphing however is that it allows us to more readily determine the set of points that define a polygonal convex set (hereafter PCS) as indicated by the overlapping shaded regions of the inequality.
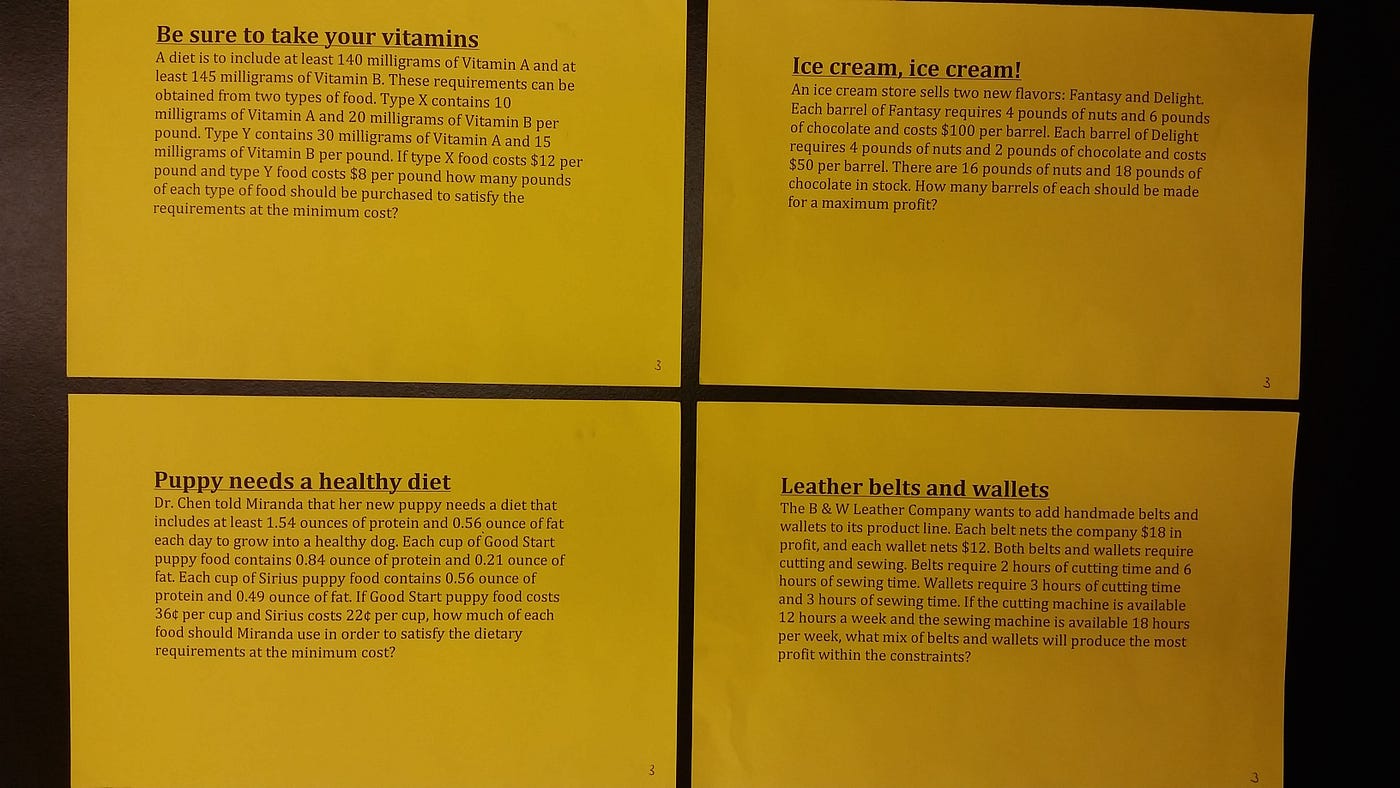
Just as in my business model performance task, the focus here is not so much on learning new technical skills. Instead, we relied on our existing skills to apply mathematical concepts to real world situations -in this case, optimization by minimizing cost or maximizing profit. Although the students were allowed to work with their groups, each student was responsible for one of the following scenarios:
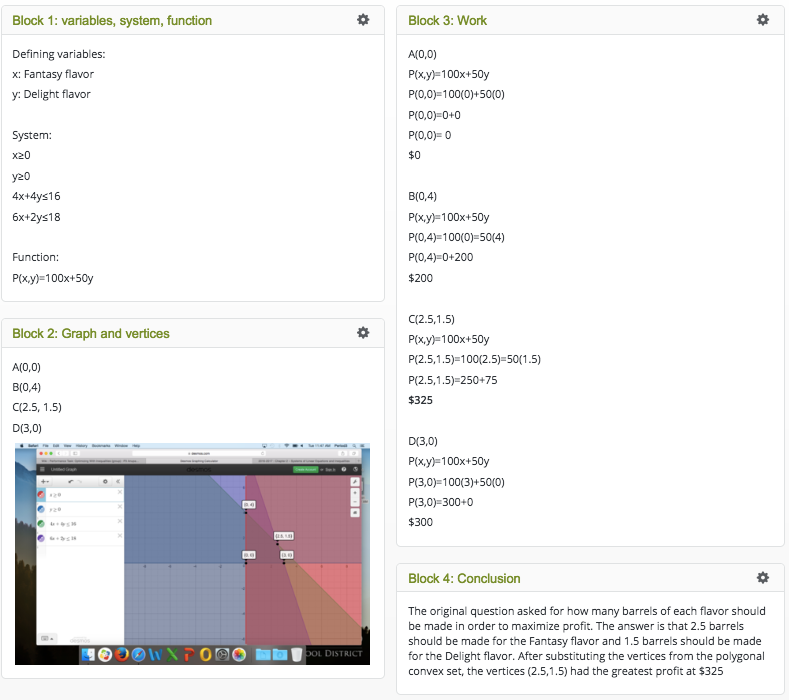
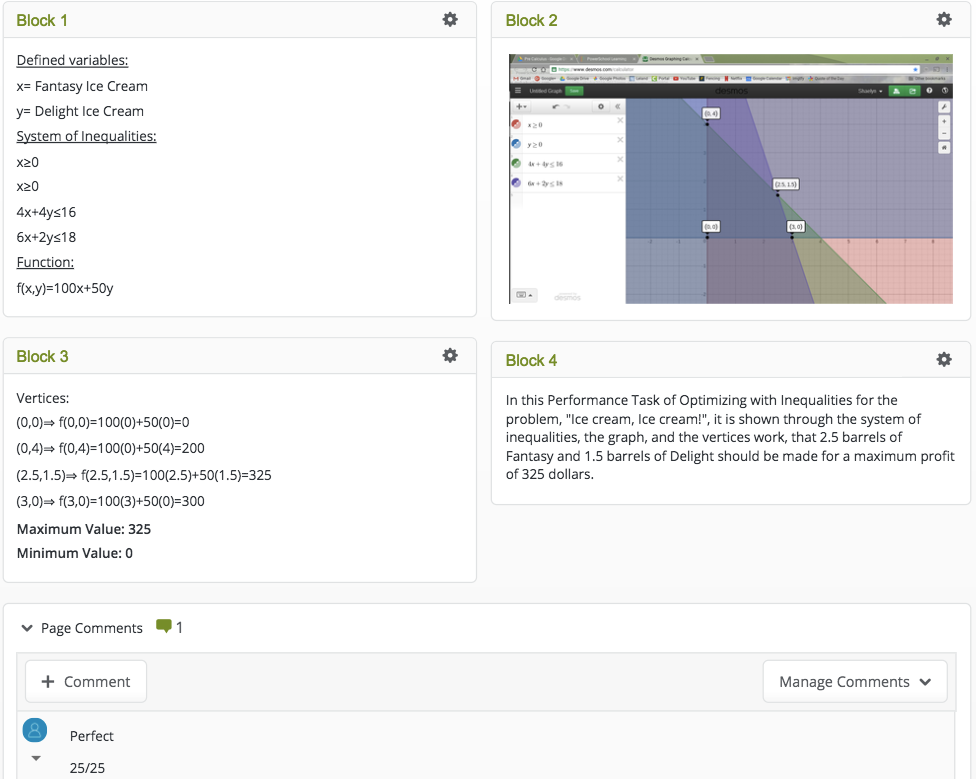
To solve these problems, the students first had to define their variables, set up a system of inequalities, and determine a function to represent the cost or profit to be optimized. To obtain the solution, they used the Desmos Graphing Calculator to
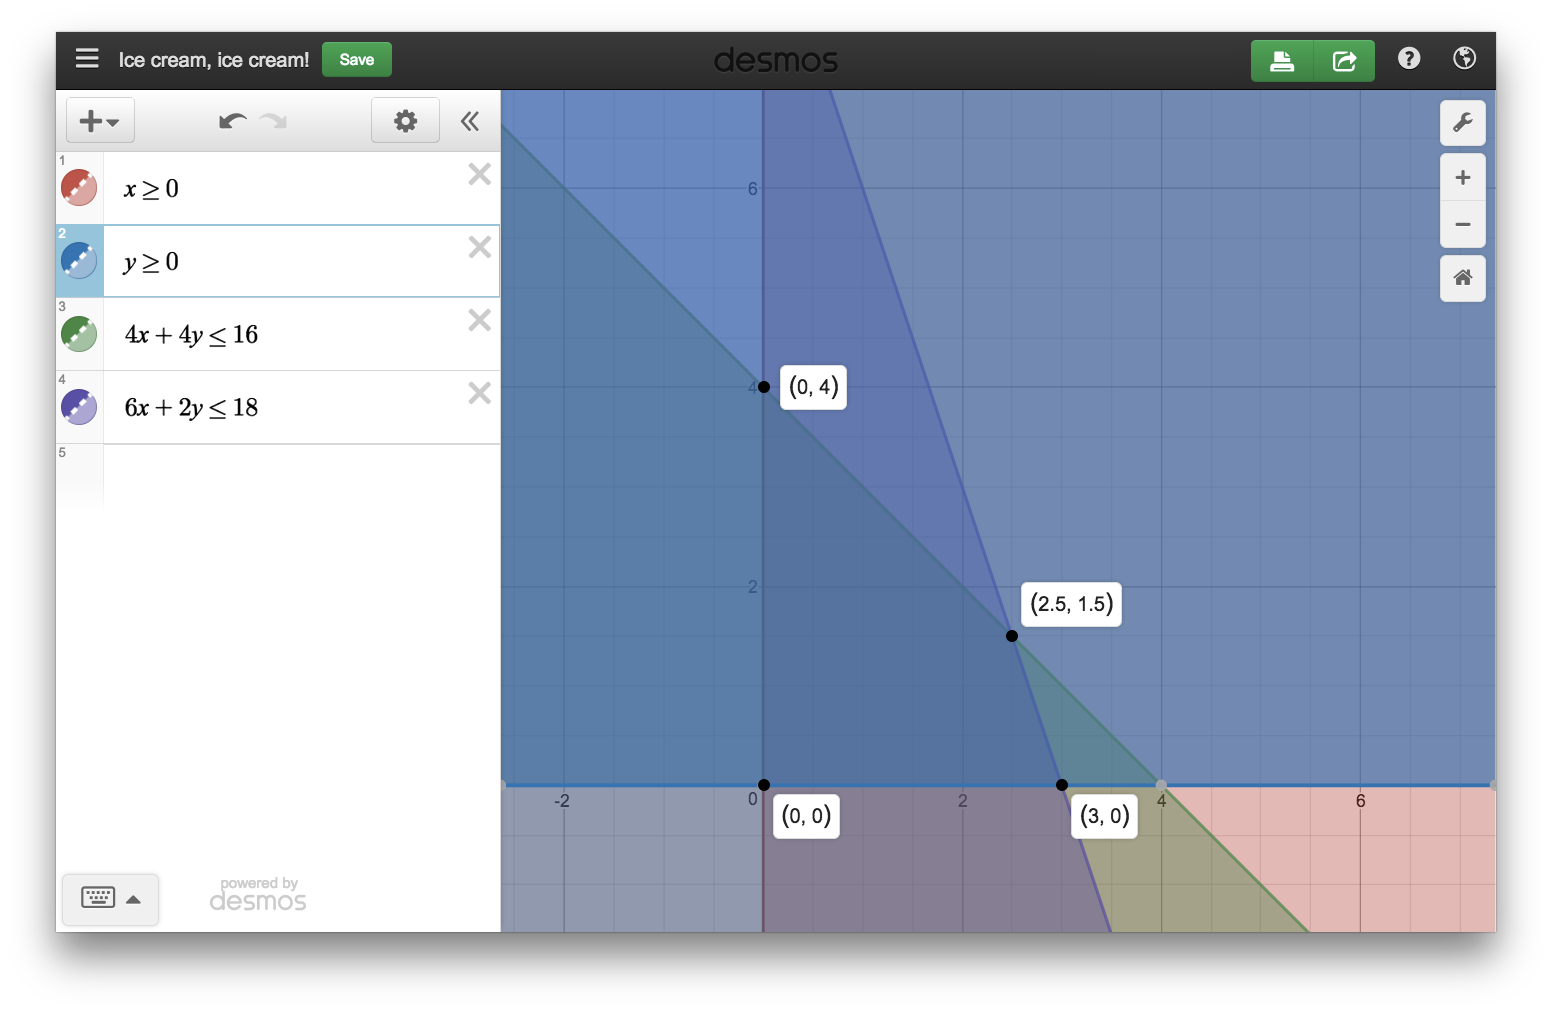
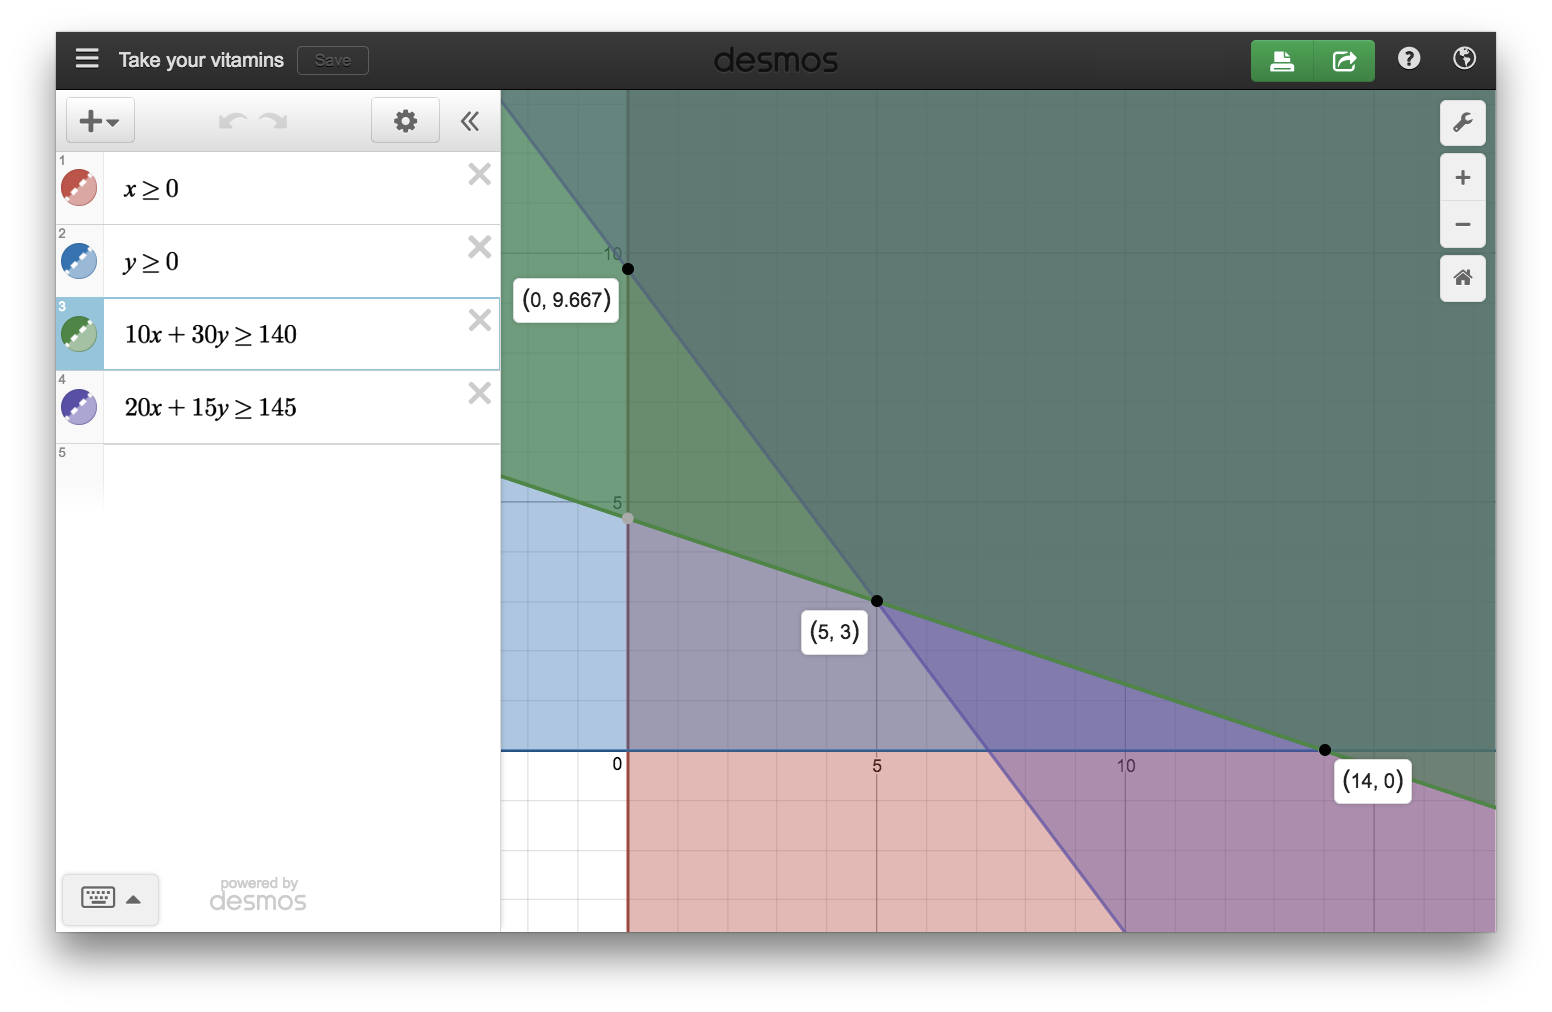
- find vertices, defining the values to yield a max or min for their function. This can be done by simply clicking the points of intersection in DESMOS for each pair of lines (or solving a system of equations in their matrix calculator).
- find overlapping region to define their PCS. This is displayed by DESMOS as the most opaque of the regions.
- change the size of the graph window. This can be done by either clicking the "+" and "–" buttons in the top right corner or using the scroll feature on a trackpad.
Other skills that were necessary for this task included
- taking a screenshot -I require students Google how to do this as the method varies by device
- inserting and resizing an image -although they could do this with an image editor, this can also be done within the LMS
- create an opportunity for discussion about caution about what is included in their screenshot (e.g. mayor's major screenshot fail)
In the end, the projects came out complete and looking good. Here are a couple student samples:
One of the major challenges of this project is that although it was a group project, the students were quite limited on time. This was by design to help prevent groups from relying on one student to do all of the work as that student would simply not have enough time to get even half of the work done. As a result, students were coerced into collaborating while also being held accountable for producing their own solutions. There was enough time for members to peer review and each other's work to help improve the quality of the product and it showed.
This does not mean no difficulties or conflicts arose, just that they were very limited. However, I will save that discussion for the topic of another post later on.
Finding Optimal Solution on Graphing Calculator
Source: https://stevens-michael-a.medium.com/optimization-with-desmos-graphing-calculator-spreadsheets-optional-6660cb07c3a3